
No matching terms found
Try a different search term or clear the tag filter.
The process of dividing a field into spatially distinct management zones based on soil properties, historical yield data, topography, and remote sensing indices. Each zone is treated as a discrete management unit enabling variable-rate input application.
Statistical or ML-based identification of unusual patterns in crop health, soil moisture, or sensor telemetry that deviate significantly from historical baselines. Used to trigger early-warning alerts for pest pressure, irrigation failure, or equipment malfunction.
Pre-processing step applied to raw satellite imagery to remove atmospheric scattering and absorption effects caused by aerosols, water vapour, and gases. Converts Top-of-Atmosphere (TOA) reflectance to surface (Bottom-of-Atmosphere) reflectance for accurate NDVI computation.
The volume of water that a soil can store and make available to crops between field capacity and permanent wilting point. Expressed in mm/m or %. A critical parameter for irrigation scheduling models and drought stress prediction in precision agriculture platforms.
The estimated greenhouse gas emissions that would have occurred without a carbon project intervention. Established using historical farm records, regional emission factors, and IPCC methodology. Baseline emissions are the reference point from which carbon credits are calculated.
Any index computed by dividing one spectral band value by another to highlight specific vegetation, soil, or water properties. NDVI, EVI, SAVI, and NDWI are all band ratio indices derived from multispectral satellite sensors such as Sentinel-2 or Landsat-8.
The dry mass of soil per unit volume (g/cm³). High bulk density indicates soil compaction, reducing water infiltration and root penetration. Measured by field core sampling or estimated from IoT penetrometer sensors and correlated with yield loss risk models.
A tradeable certificate representing one metric tonne of CO₂e removed from or not emitted into the atmosphere. In agriculture, credits are generated through practices such as no-till farming, cover cropping, and improved nitrogen management. Verified under standards like Verra VCS, Gold Standard, or ACR, and monetised through voluntary or compliance carbon markets.
The long-term removal and storage of atmospheric CO₂ in soil organic matter, biomass, or geological formations. Agricultural carbon sequestration is driven by soil organic carbon (SOC) accumulation through cover cropping, minimal tillage, biochar application, and agroforestry integration.
The surface temperature of a crop canopy as measured by thermal infrared sensors on satellites, UAVs, or ground-based devices. Canopy temperature relative to air temperature (the Crop Water Stress Index, CWSI) is a key indicator of plant transpiration deficits and drought stress onset.
A standard unit for measuring the global warming potential of greenhouse gases relative to CO₂. Methane (CH₄) = 28x CO₂e; Nitrous oxide (N₂O) = 265x CO₂e over a 100-year horizon (GWP100). All GHG accounting in agricultural carbon programmes uses CO₂e as the common denomination.
A dimensionless index ranging from 0 (no stress) to 1 (maximum stress) quantifying crop water deficit based on canopy-to-air temperature differentials. Computed as: CWSI = (Tc − Ta − ΔT_lower) / (ΔT_upper − ΔT_lower). Used to trigger precision irrigation events in automated farm management systems.
A virtual real-time replica of a physical farm system that integrates sensor telemetry, satellite imagery, weather models, and agronomic knowledge to simulate crop behaviour, test management decisions, and predict outcomes before implementation in the field.
A three-dimensional representation of terrain topography derived from LiDAR, SAR interferometry, or photogrammetry. DEMs are used in precision agriculture to model water flow, erosion risk, cold air drainage, and shadow patterns that affect crop growth and NDVI interpretation.
An accumulated thermal unit measuring heat availability for crop development, calculated as: GDD = [(T_max + T_min)/2] − T_base. Each crop species has a specific base temperature and GDD requirement for each phenological stage. IoT weather stations compute GDD in real time to schedule scouting, spraying, and harvest windows.
A microbial process in waterlogged soils that converts nitrate (NO₃⁻) into nitrogen gases (N₂ and N₂O). N₂O is a potent greenhouse gas (265× CO₂e), making denitrification a key emission source in agricultural GHG accounting and a target for precision nitrogen management strategies.
Processing data on or near the IoT sensor device rather than transmitting all raw data to a central cloud. Farm edge nodes pre-process soil, weather, and plant sensor streams, apply local inference models, and transmit only derived insights — reducing bandwidth requirements and enabling operation in low-connectivity environments.
An optimised vegetation index developed by NASA that reduces atmospheric and soil background noise compared to NDVI: EVI = G × [(NIR − Red) / (NIR + C₁×Red − C₂×Blue + L)]. More sensitive in dense canopy regions where NDVI saturates. Standard coefficients: G=2.5, C₁=6, C₂=7.5, L=1.
A coefficient that converts activity data into greenhouse gas emission quantities. For example, IPCC Tier 1 default EF for synthetic nitrogen applied to cropland is 1% direct N₂O-N. Emission factors are published by the IPCC, EPA, and UNFCCC and applied in life cycle assessment and carbon credit methodologies.
EU Regulation 2023/1115 requiring operators placing cattle, cocoa, coffee, palm oil, soy, wood, rubber, and derived products on the EU market to prove they were not produced on land deforested after December 31, 2020. Compliance requires satellite-verified geolocation data for each production plot — a use case directly served by VersaAgro's knowledge graph.
The maximum amount of water a soil can hold against gravity after free drainage has ceased, typically expressed as volumetric water content (%). Measured at −33 kPa soil water potential. Field capacity is the upper bound for irrigation scheduling and a key parameter in AWC calculations.
A systematic risk analysis framework applied to IoT sensor networks and farm automation systems to identify, prioritise, and mitigate potential failure modes. In precision agriculture, FMEA is used to design resilient sensor mesh deployments and ensure data quality continuity under field conditions.
The ratio of crop nutrient uptake to total nutrient applied, expressed as a percentage. Low FUE (e.g., 30–50% for nitrogen) indicates environmental losses through leaching, volatilisation, or denitrification. Precision variable-rate application and split-dose scheduling are the primary tools for improving FUE.
An open standard format for encoding geographic data structures using JSON. In precision agriculture, GeoJSON is the primary format for field boundary polygons, management zone delineations, sensor placement coordinates, and satellite-derived crop health layer delivery via REST APIs.
Systematic quantification, reporting, and verification of greenhouse gas emissions and removals from farm operations including enteric fermentation, manure management, synthetic fertiliser N₂O, rice paddy CH₄, fuel combustion, and soil carbon changes. Governed by IPCC, GHG Protocol, and ISO 14064 standards.
A precisely surveyed point on the Earth's surface with known coordinates used to geometrically correct satellite imagery, UAV orthomosaics, and LiDAR point clouds. GCPs improve spatial accuracy of field boundary delineation and multi-temporal NDVI comparison by eliminating geolocation drift.
A network of connected physical sensing devices deployed in farm fields that collect and transmit environmental data including soil moisture, temperature, electrical conductivity, leaf wetness, wind speed, rainfall, and crop canopy microclimate. Farm IoT nodes communicate via LPWAN protocols (LoRaWAN, NB-IoT, Sigfox) to edge gateways and cloud platforms.
The process of determining optimal timing and quantity of water application based on soil water tension (tensiometry), evapotranspiration models (FAO Penman-Monteith), weather forecasts, and crop growth stage. Automated systems trigger irrigation events when VWC or CWSI crosses defined thresholds.
A structured graph database representing agronomic entities and their semantic relationships — linking crop varieties, field parcels, soil types, weather events, sensor readings, pest pressures, and trade compliance data. VersaAgro's knowledge graph uses RDF/OWL ontologies and SPARQL queries to power multi-hop inference across farm, crop, and supply chain nodes.
A consolidated visual interface displaying key performance indicators for farm productivity, input efficiency, crop health, and sustainability metrics. Core agronomic KPIs include NDVI trend, soil moisture deviation, actual vs. potential yield, nitrogen use efficiency, and carbon balance. Enables farm managers and agronomists to act on real-time intelligence.
A class of wireless communication protocols designed for long-range, low-power IoT sensor transmission. Leading technologies include LoRaWAN (up to 15km rural range), NB-IoT (licensed spectrum, deep penetration), and Sigfox. LPWAN enables cost-effective IoT deployments across large farm areas with years of battery life per node.
A dimensionless ratio representing the total one-sided leaf area per unit ground surface area (m²/m²). LAI is a primary driver of crop light interception, photosynthesis, and biomass accumulation. Estimated from Sentinel-2 RED-EDGE and NIR bands with strong correlation to NDVI and used in yield prediction models.
Spatially delineated sub-field regions that express relatively homogeneous combinations of yield-limiting factors. Defined by cluster analysis of soil EC, pH, OM, historical yield maps, and multi-year NDVI composites. Management zones form the spatial foundation for variable-rate input prescriptions in precision agriculture.
The framework for quantifying, documenting, and independently verifying carbon project outcomes. In agriculture, MRV combines on-farm activity data, soil sampling, remote sensing validation, and third-party audits to issue verified carbon credits. Digital MRV platforms use satellite and IoT data to reduce manual monitoring costs by up to 80%.
Satellite or UAV imagery captured in multiple discrete spectral bands beyond visible light, including near-infrared (NIR), red-edge, and shortwave infrared (SWIR). Multispectral data enables computation of vegetation indices (NDVI, EVI, NDWI) and chlorophyll content estimation impossible with standard RGB cameras.
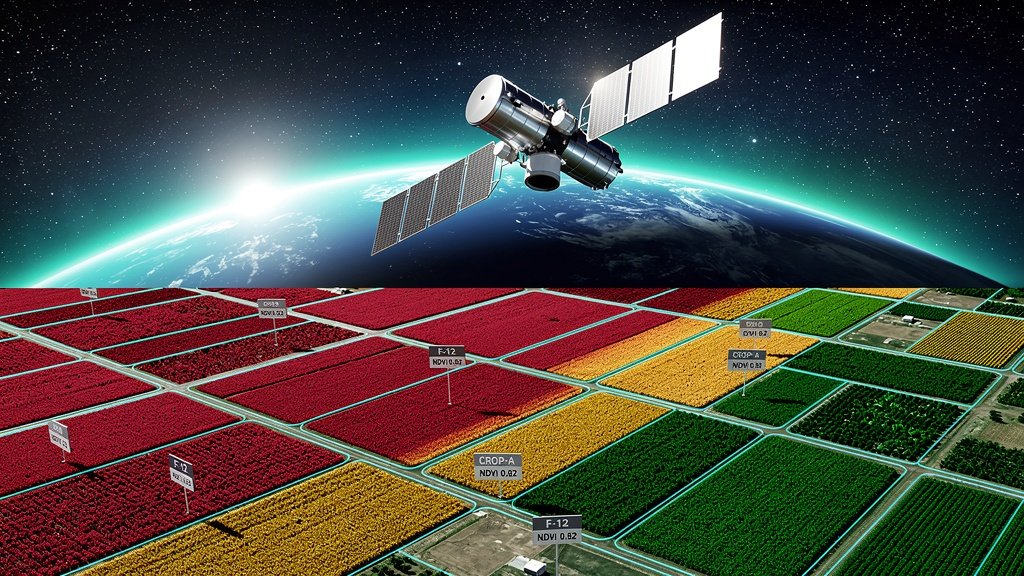
The most widely used remote sensing index for quantifying vegetation density and health, calculated as: NDVI = (NIR − Red) / (NIR + Red). Values range from −1 to +1: water < 0, bare soil 0.1–0.2, sparse vegetation 0.2–0.4, dense healthy canopy 0.6–0.9. Derived from Sentinel-2 Band 8 (NIR) and Band 4 (Red) at 10m resolution.
A spectral index for mapping open water bodies and crop water content in plant tissue: NDWI = (Green − NIR) / (Green + NIR). Gao's variant uses (NIR − SWIR) / (NIR + SWIR) for canopy water content. Positive values indicate water presence; negative values indicate soil/vegetation. Applied in flood mapping, irrigation monitoring, and drought stress detection.
The proportion of applied nitrogen taken up by the crop and converted to yield, expressed as kg grain per kg N applied or as a percentage. Global average NUE for cereals is approximately 40%, meaning 60% is lost to the environment. Improving NUE through split applications, urease inhibitors, and precision variable-rate is both an economic and GHG reduction imperative.
The study of periodic biological events in crop development — germination, leaf emergence, tillering, flowering, grain fill, and maturity — and their relationship to environmental drivers (temperature, photoperiod, rainfall). Accurate phenology modelling, driven by GDD accumulation from IoT weather stations, underpins precise timing of agronomic interventions.
The process of assigning each satellite image pixel to a discrete land cover or crop type category using supervised or unsupervised machine learning algorithms (random forest, SVM, CNN). Enables automated crop mapping at field resolution from Sentinel-2 time-series and is a prerequisite for accurate per-crop NDVI analysis.
A farm management philosophy and technology framework that uses spatial and temporal data to optimise inputs at the sub-field scale, maximising output while minimising environmental impact. Core enabling technologies include GPS/GNSS, remote sensing, IoT sensors, variable-rate machinery, and AI decision systems.
A spectral region (~700–750nm) at the sharp boundary between chlorophyll absorption and NIR reflectance in plant canopies. Sentinel-2 provides three red-edge bands (B5: 705nm, B6: 740nm, B7: 783nm). Red-edge indices are highly sensitive to chlorophyll content and early stress, outperforming standard NDVI in dense crop canopies.
The temporal frequency at which a satellite sensor revisits the same ground location. Sentinel-2 (twin satellite constellation) achieves a 5-day revisit globally at 10m resolution. Revisit time determines the temporal resolution of NDVI monitoring and limits early detection of rapidly evolving crop stress events.
ESA's twin-satellite multispectral imaging mission providing free, open-access imagery at 10–60m resolution across 13 spectral bands with a 5-day revisit cycle. The primary data source for operational NDVI, EVI, LAI, and crop type mapping at global scale. Bands 4 (Red, 665nm) and 8 (NIR, 842nm) are used for standard NDVI computation.
A vegetation index that minimises soil background reflectance effects in sparse crop canopies: SAVI = [(NIR − Red) / (NIR + Red + L)] × (1 + L), where L is a correction factor (typically 0.5). More accurate than NDVI in early-season or semi-arid conditions with <25% canopy cover.
The carbon stored in soil organic matter, including decomposing plant residues, microbial biomass, and stable humus fractions. Expressed in % or t/ha. SOC is both the primary indicator of soil health and the currency of agricultural carbon sequestration — each 0.1% increase in SOC on 1 hectare represents approximately 3–4 tonnes CO₂e removed.
A measure of the ability of soil to conduct electrical current, expressed in dS/m or mS/cm. Soil EC integrates multiple soil properties — clay content, salinity, organic matter, cation exchange capacity, and moisture — into a single proxy metric widely used to delineate management zones and guide soil sampling strategies.
The examination of sequential NDVI observations over a growing season or multiple years to detect phenological patterns, anomalies, and long-term trends in crop health. Smoothing algorithms (Savitzky-Golay, TIMESAT) are applied to cloud-contaminated or noisy NDVI time series to extract robust growing curves for yield forecasting and stress event dating.
Radiance values recorded by satellite sensors before atmospheric correction, including contributions from atmospheric scattering and absorption. TOA reflectance is always higher than surface reflectance for vegetation bands. NDVI computed from TOA data is less accurate than from atmospherically corrected surface reflectance products (Sentinel-2 L2A).
The site-specific application of crop inputs (seed, fertiliser, pesticide, water) at varying rates across a field based on prescription maps derived from management zone delineation, NDVI analysis, and soil test data. VRA can reduce input costs by 10–25% and significantly cut nutrient runoff and GHG emissions.
The volume of water per unit volume of soil, expressed as a fraction (0–1) or percentage (0–100%). Measured in real-time by capacitance, TDR, or FDR soil moisture sensors deployed by IoT networks. VWC is the primary trigger metric for precision irrigation systems and a key input to CWSI and AWC calculations.
The ratio of crop yield or biomass produced per unit of water consumed (kg/m³ or kg/mm). WUE quantifies the productivity of water inputs and is a primary metric for sustainable irrigation management. Improved through deficit irrigation strategies, drip systems, and real-time soil moisture monitoring via IoT networks.
A terrain-derived index calculated as: TWI = ln(α / tan β) where α = upslope contributing area and β = slope angle. TWI predicts zones of soil moisture accumulation and surface saturation across a landscape, enabling delineation of high-drainage vs. waterlogging-prone management zones within field-scale digital elevation models.
Quantification of the difference between actual farm yield and attainable or potential yield given the biophysical environment. Yield gaps are decomposed into efficiency gap (sub-optimal management) and resource gap (unavoidable bio-physical constraints). NDVI anomaly detection, soil test integration, and ML-based field benchmarking are core tools for yield gap identification in precision agriculture.
A statistical or machine learning model that estimates end-of-season crop yield from in-season data streams including cumulative NDVI, growing degree days, rainfall, soil fertility, and management history. VersaAgro's transformer-based yield models achieve ±8% RMSE at parcel level 6 weeks before harvest across wheat, maize, and soy.