6 Interactive Prototype Screens

Every Decision Surface, Covered

A complete platform from field telemetry to boardroom ESG reporting — explore every screen of the VersaAgro prototype and see the full intelligence stack in action.

Start with Dashboard Request Access
6 Prototype Screens
12+ Interactive Charts
Live Sentinel-2 Data
8 IoT Device Views
Carbon Marketplace
AI Semantic Query
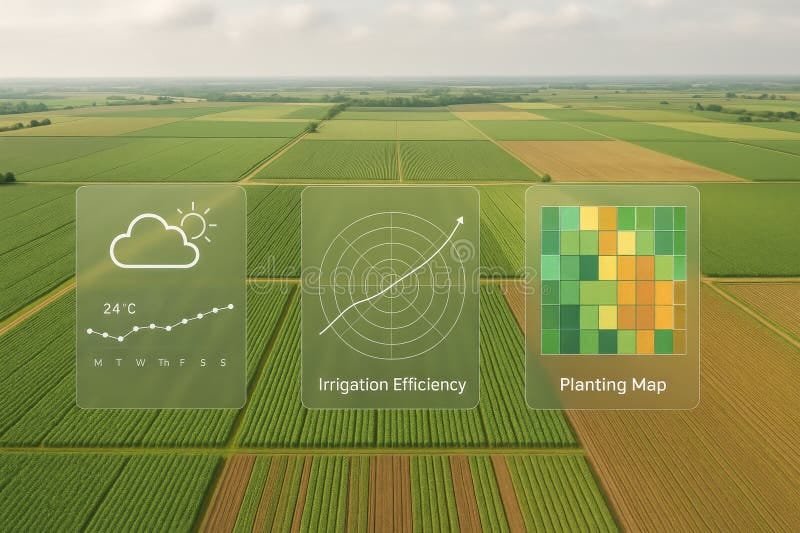
Smart farming dashboard showing weather, irrigation and planting data over agricultural fields
Field Telemetry Dashboard
Live Weather Bar NDVI Field Map Yield Trend Chart IoT Device Table AI Query Box Crop Rotation Timeline
Screen 01

Field Telemetry Dashboard

The command centre for your entire agricultural operation. Real-time weather conditions, live satellite sync status, field-by-field health scoring, and AI-powered semantic queries — all on one screen.

Live Weather Bar
Temperature, humidity, wind, 7-day precipitation strip, GDD accumulation counter, and frost risk chip — sourced from hyper-local IoT weather station.
NDVI Field Map with Zone Pins
Switchable satellite layers (NDVI / RGB / Water Stress / Thermal) with clickable zone pins and a field list panel showing all 7 managed parcels.
AI Semantic Query
Natural-language query box with 4 pre-built quick queries. Simulates AI-powered responses correlating NDVI, weather, IoT, and GDD data in plain English.
IoT Device Registry
8-device live telemetry table showing sensor type, field assignment, latest reading, battery %, signal strength, and sync status.
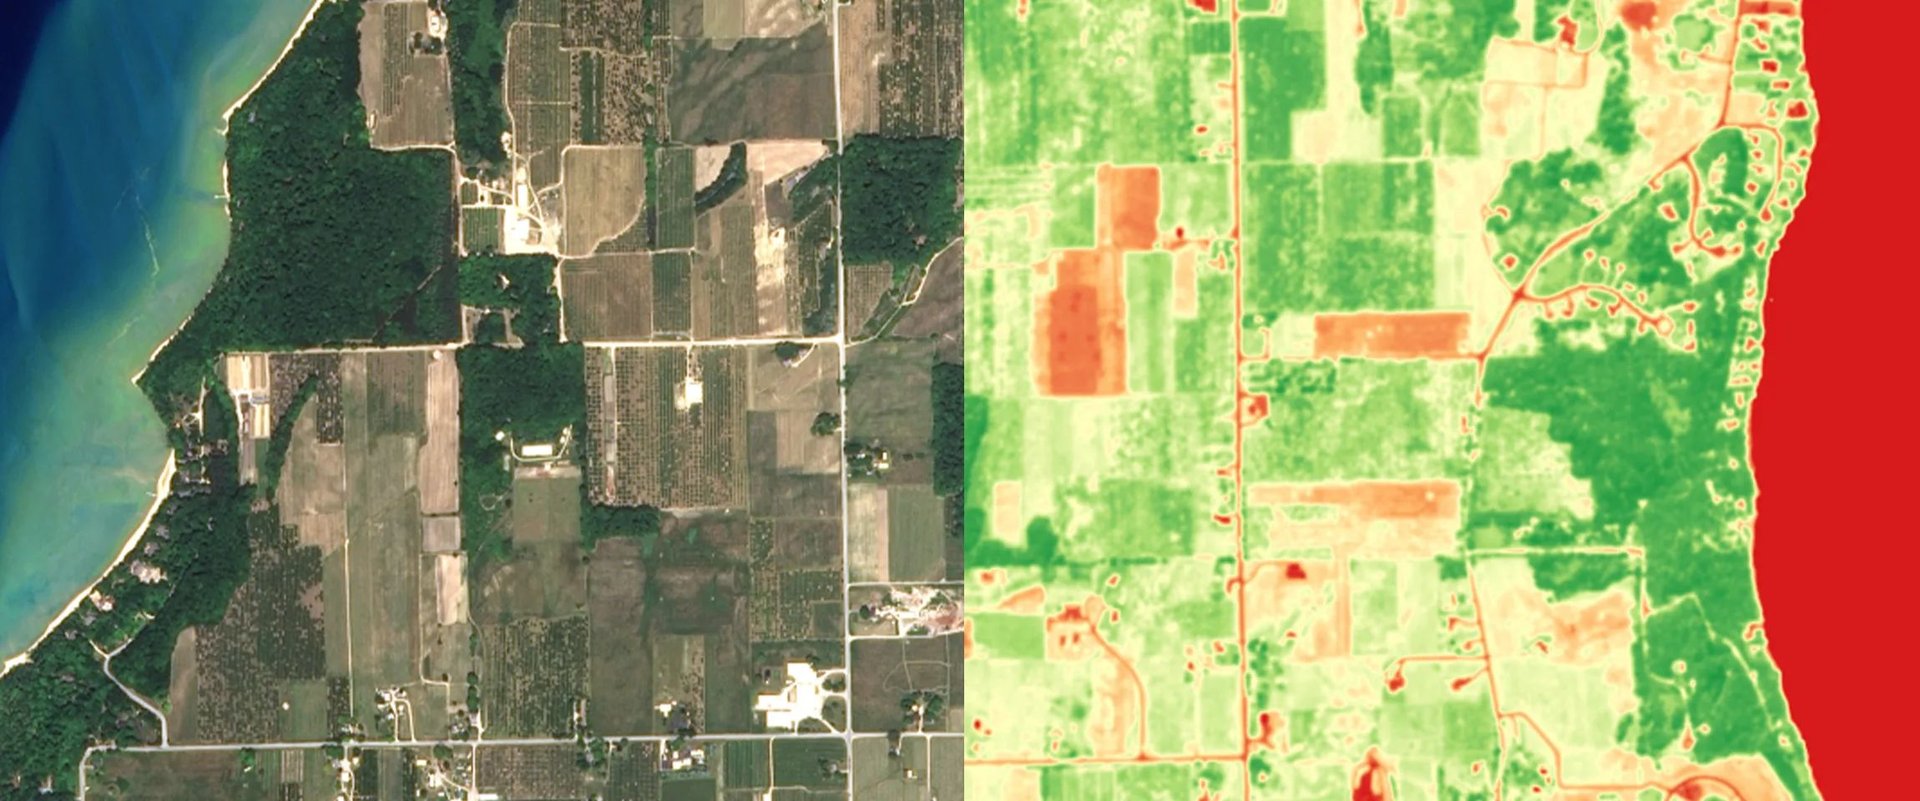
NDVI satellite crop health analysis showing vegetation index maps across farmland
NDVI Crop Intelligence
Zone NDVI Scores Digital Twin KPIs Plant-Level Grid Scan History Table Dual-Axis Chart
Screen 02

Crop Intelligence & NDVI Analysis

The deepest field intelligence in the platform. Zone-by-zone NDVI scoring, a 12×12 plant-level cell grid representing Sentinel-2 pixels, digital twin metrics, and full scan history with satellite metadata.

5-Zone NDVI Analysis Panel
Each zone shows NDVI score (0–1), week-on-week trend, status badge, and specific agronomic recommendation — from "Continue schedule" to "Immediate irrigation failure inspection."
Digital Twin — 6 Live KPIs
GDD 1,842°C·day · R4 Growth Stage · Yield Forecast 8.4 t/ha · Harvest Sep 14 · Field Capacity 84% · Stress Level Low — all updated per scan cycle.
144-Cell Plant-Level Grid
Visual 12×12 matrix representing 10m×10m Sentinel-2 pixels — colour-coded green/yellow/orange/red by NDVI value, providing sub-field spatial awareness at the plant level.
Storm building over coastal farmland — Weather Intelligence Screen
Weather Intelligence
Hyperlocal Forecast Spray Window Planner Multi-Vector Risk GDD Tracking 7/30-Day Outlook
Screen 03

Weather Intelligence

Field-level forecasting built for operational decisions — hyperlocal current conditions, hourly and 7/30-day outlooks, growing-degree-day accumulation, and multi-vector weather risk scored against what is actually planted in each field, not the nearest airport.

Hyperlocal Field Forecasts
Current conditions, precipitation, wind and temperature resolved to each field boundary, with hourly granularity out to 48 hours and outlooks to 30 days.
Multi-Vector Weather Risk
Storm, hail, frost and heat-stress vectors scored per crop stage with confidence levels and timing windows — feeding directly into the Alerts & Risk screen.
Spray & Operations Windows
Application windows gated by wind, rain and humidity thresholds, paired with GDD-based growth staging so every pass lands inside the safest slot.
Live Telemetry
NDVI −0.24 · Zone 7
Aphid Risk 74/100
FC 18% ↓
Sentinel-2 Synced
Filter Pills 3 Live Alerts Pest Radar Chart 5×5 Risk Matrix 7-Day Forecast
Screen 04

Alerts & Risk Management

Multi-vector risk intelligence for irrigation failure, pest pressure, frost advisories, and drought events — each alert includes financial loss estimates, contributing factor analysis, and numbered remediation steps.

Critical: Jalisco Irrigation Failure
Sector 3 soil FC dropped to 18% (threshold 35%), NDVI decline −0.24 in 72h, estimated crop loss $48,000. 4-step remediation protocol displayed.
Warning: Aphid Pressure (Kansas Wheat)
Risk score 74/100. Temperature-humidity correlation, crop phenology overlap. Scouting threshold: 80 aphids/sweep. $22,400 financial exposure modelled.
Warning: Frost Advisory (−2.1°C in 36h)
72% confidence forecast. Two pre-emptive actions: activate wind machine and apply frost protection foliar. $18,600 at risk.
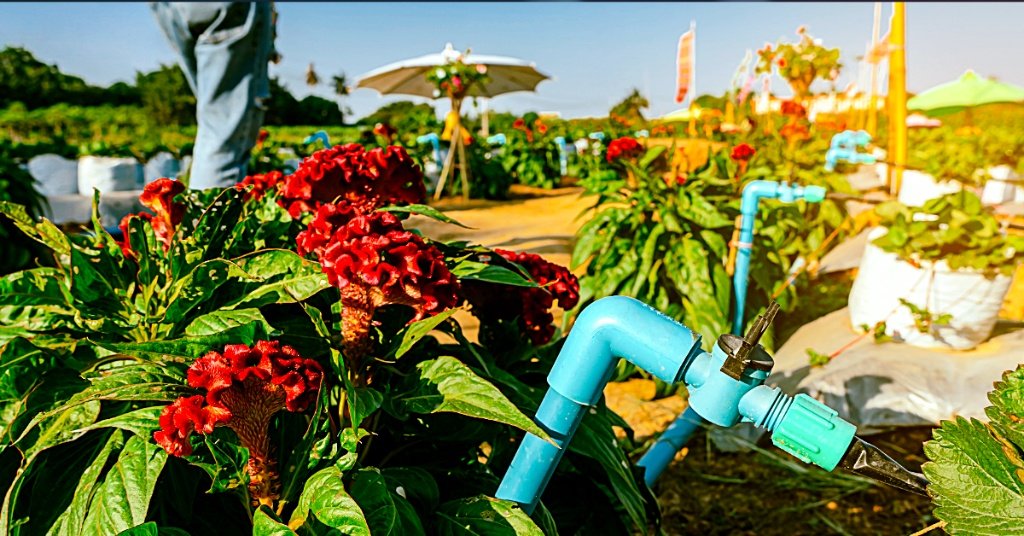
Precision drip irrigation system with blue PVC fittings among blooming celosia flowers — Irrigation Intelligence Screen
14 Sensors Live
⚠ Zone 1 — 18% FC
−34%
Water Saved
6.2mm
ET₀ Demand
3 Active
Zones Running
Irrigation Intelligence
IoT Soil Sensors FAO ET₀ Model Auto-Schedule Zone Map Line Failure Detection
Screen 05

Irrigation Intelligence

Real-time soil field-capacity monitoring across 6 irrigation zones, FAO Penman-Monteith ET₀ modelling, IoT-triggered auto-scheduling, and irrigation line failure detection — all before visible crop damage occurs. A core commercial offering of the VersaAgro platform.

Precision Water Scheduling
IoT VWC sensors trigger irrigation events when field capacity drops below crop-specific thresholds. Auto-schedule optimises run timing to pre-dawn slots, reducing evaporative loss by ~22%.
Line Failure Detection
Three-signal convergence: sensor FC doesn't rise post-run + NDWI no canopy moisture increase + NDVI rate-of-change divergence. Detects failures 24–48h before visible wilting. Proven: $48,000 loss prevented.
Water Efficiency Metrics
Season-over-season: −34% water applied, 0% yield suppression, +12% nitrogen uptake efficiency. ET₀ vs. applied comparison chart using FAO Penman-Monteith reference evapotranspiration model.
Regenerative agriculture field showing soil carbon sequestration and sustainable farming practices
Carbon & ESG Intelligence
ESG Hero Banner Carbon Marketplace GHG Scopes 1/2/3 Compliance Status ESG Scorecard
Screen 06

Carbon & ESG Intelligence

From verified sequestration tracking to live carbon credit marketplace pricing — the complete ESG intelligence hub for enterprise reporting, regulatory compliance, and offset monetisation.

Carbon Credit Marketplace
Live prices from 4 registries: VCM $66.75/t, EEX €58.40/t, Verra VCS $52.20/t, CAR $44.80/t — each with 24h price change indicators.
Compliance Framework Status
EU Taxonomy ✓ · GHG Protocol ✓ · CSRD/ESRS ✓ · Gold Standard ⏳ Audit · Verra VCS ✓ — all with verification dates and audit trail links.
ESG Scorecard — Overall A−
Environmental A−, Social B+, Governance B — with narrative justification and improvement pathway for each dimension.
Beta Pilot Open

Ready to Deploy on Your Operation?

Join the pilot programme and get a personalised NDVI analysis of your fields within 5 business days of onboarding.